Swinburne Design and Boroondara Council improve customer experience

In Summary
- This Visualising Community Experiences project has resulted in the development of unique customer journey mapping tools
- Circular customer-centric diagrams communicate a higher-level mapping of customer life events
In July 2017 the City of Boroondara in Melbourne’s inner east was exploring better ways to understand its customers. After a comprehensive series of workshops, data collected highlighted significant life events typically experienced throughout the Boroondara community.
Swinburne researchers Dr Christopher Waller, Associate Professor Simone Taffe and Associate Professor Kurt Seemann, Director - Centre for Design Innovation, were engaged to work on the council’s Customer Experience Improvement Strategy.
The aim of the research was to investigate how the data obtained from the workshops could be optimised through customer journey mapping. Customer journey maps are now a popular tool to communicate customer experience within human-centred service design processes. Journey maps use information design to create tables, charts, timelines or diagrams to communicate aspects of a customer’s experiences with a service in user-friendly ways.
Led by Dr Waller, Swinburne researchers used co-design and information design research methods, supported by evidence-based research, to design visual customer journey mapping tools for use in the local government context by the City of Boroondara.
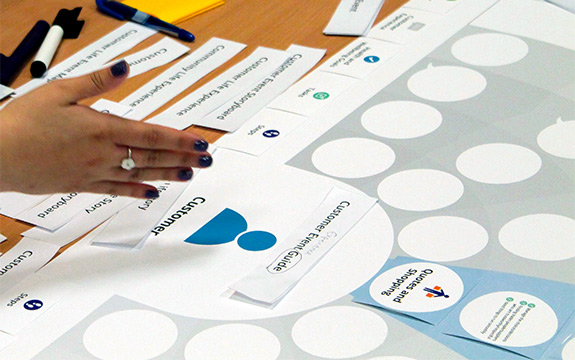
This Visualising Community Experiences project has resulted in the development of unique customer journey mapping tools and toolkits for the City of Boroondara. Dr Waller and his fellow researchers developed a set of nine Customer Life Event Guide journey map designs and a reference guide.
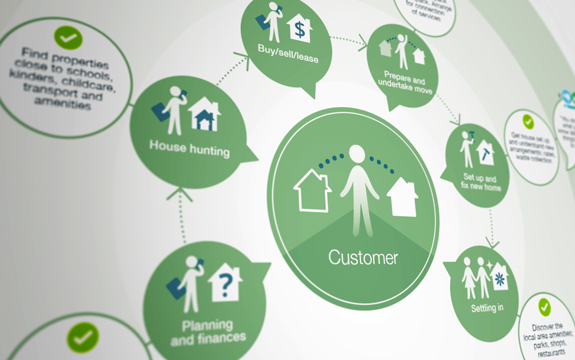 Customer Life Event, journey map design supporting residents purchasing a new home.
The project has addressed the questions of how customer journey mapping tools can improve the customer-centricity of council processes and how the design of these mapping tools can effectively communicate customer voices throughout an organisation and across time.
“We focused on creating customer journey mapping tools that would most effectively communicate the Boroondara ‘Voice of the Customer’ and the final design for each Customer Life Event Guide uses two complementary maps for each of the nine Customer Life Events,” says Dr Waller.
"During co-design workshops where we worked with council staff to design maps and tools together, it became apparent that both a circular diagram and a table with cross referencing would work best."
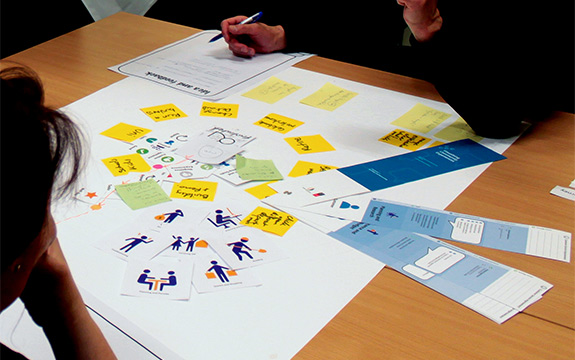 Sharing ideas in co-design workshops with Swinburne researchers and Boroondara Council staff.
The circular customer-centric diagram communicates a higher-level mapping of customer life events, supported by a reference table with more detail about customer steps, goals, plus positive and negative experiences (or pain and delight points). A further outcome is a template for the Customer Life Event Guides for future use by council.
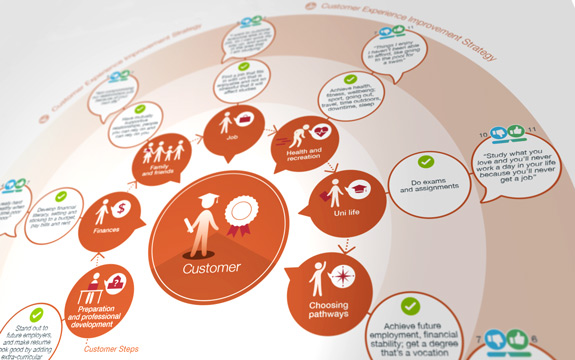 Customer Life Event, journey map supporting education.
Understanding the customer viewpoint and putting the customer at the centre, visually and symbolically, was crucial to the research for communicating insights into the customer viewpoint and bringing the customer voice to life across the organisation.
The project outcomes have demonstrated the potential for journey mapping tools to assist council teams to transform Boroondara’s organisational approach towards a more customer-centric culture and develop service design processes that lead to improved experiences for their community.